
Measurement
Podcast ad frequency and reach
Plan estimated podcast reach and repeat delivery, check measurement definitions, and read campaign response without overstating what was heard.
Podcast reach estimates how many distinct recipients were served an ad during a stated period. Frequency is the average number of deliveries per estimated recipient. Plan the two together: more placements can increase repeat delivery, while additional shows may add new recipients. Placement count alone cannot tell you which will happen.
Check what the figures count
Ask whether a reach figure describes a show's audience or recipients of your campaign ad. They are different. In much open podcast distribution, delivery is measured using server-side logs.
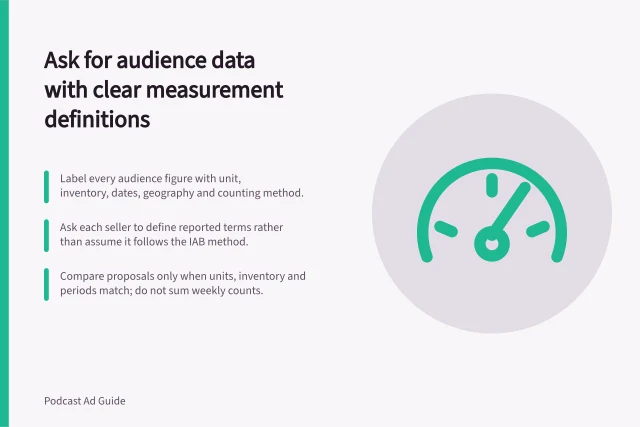
Record the campaign dates, eligible Australian geography, included inventory and the method used to estimate unique recipients. Weekly reach figures cannot simply be added to obtain campaign reach, because recipients may appear in several weeks. If a seller cannot deduplicate the whole buy, ask which inventory its combined estimate covers.
Reach vs Frequency: Key Differences in Podcast Advertising
- Reach
- Number of distinct recipients served an ad during a period
- Frequency
- Average number of ad deliveries per estimated recipient
Read average frequency with its limits
Average frequency equals delivered ad impressions divided by estimated unique reach, using the same inventory and period for both figures. For example, 60,000 delivered impressions divided by 30,000 estimated recipients gives an average of two. These are illustrative figures, not campaign results.
An average hides the spread of deliveries. If available, request the estimated share of recipients served once, twice and three or more times. Confirm whether the calculation covers an episode, a show or the entire campaign.
Choose reach or repetition deliberately
| Priority | Planning option | Check |
|---|---|---|
| Add distinct eligible recipients | Add relevant shows or inventory | Audience overlap and whether reach can be deduplicated |
| Add opportunities to encounter the message | Repeat placements across releases | Expected repeat delivery, spacing and offer accuracy |
| Limit heavy repetition | Use a frequency rule, if supported | Its window, scope, identification method and effect on delivery |
A wider mix may contain substantial audience overlap. Repeated episodes may also attract new recipients. Compare options using the same budget, dates, eligible audience and delivery definition.
Top Factors Influencing Reach and Repetition in Podcast Campaigns
- Add relevant shows or inventoryIncreases distinct eligible recipients
- Repeat placements across releasesBoosts message repetition opportunities
- Use frequency rules (if supported)Limits heavy repetition
Interpret delivery timing
Acast’s campaign analytics become available after a campaign starts. Its dashboard describes impressions as IAB-validated and says they are summarised and validated in nightly batches; the graph can therefore lag by 24–48 hours, depending on the time zone in which the ads were submitted. Treat very recent figures as provisional when reviewing progress.
Daily delivery is not necessarily even. Acast says it uses a slightly front-heavy pacing algorithm to reduce the risk of missing booked impressions, so campaigns typically deliver more at the beginning and taper towards the end. This fluctuation can be more noticeable in shorter campaigns; assess a daily dip alongside the campaign’s overall delivery rather than treating it as a reach trend on its own.
In the dashboard, delivery can be read alongside the goal, estimated reach and average impressions per listener, as well as spend and CPM. Those figures answer different planning questions: progress towards the impression goal does not by itself show whether estimated reach is growing or whether delivery is increasingly repeated.
Key Measurement Metrics for Podcast Ad Campaigns
- Impressions (IAB-validated)
- Summarised nightly, may lag 24–48 hours
- Delivery pacing
- Slightly front-heavy to reduce missed impressions
- CPM & spend tracking
- Available alongside reach and average impressions
Use show-level delivery as context
Acast’s dashboard identifies the podcasts on which the ad was served most frequently, and its help information cautions that this list is likely to feature podcasts with large audiences. A high position is therefore a description of where impressions were delivered, not a count of distinct campaign recipients.
The dashboard can show impressions and each podcast’s percentage of total delivered impressions, while the downloadable campaign report contains the full podcast list. Use this view to understand the distribution of delivery across shows, then read it alongside the campaign-level reach estimate; show impression totals alone do not establish how many distinct recipients were reached across the buy.
Confirm the measurement basis
When comparing campaign figures from different providers, first establish that their reported reach and delivery cover comparable inventory and measurement approaches.
IAB Tech Lab notes that client-side playback data is usually limited, inconsistent or unavailable in this delivery model. Its guidance also distinguishes a download from a confirmed play, and server-side ad delivery from a client-confirmed ad exposure. Keep those limits visible when interpreting estimated recipients: delivery figures do not establish that each recipient played or heard the ad.
Ask which measurement-window approach and measurement method a provider used, and whether it is consistent across the campaign figures being compared. IAB Tech Lab says companies can apply for compliance with the guidelines, while compliance details are defined separately; a general reference to the guidelines is not, on its own, confirmation of compliance.
Pros and Cons of Server-Side vs Client-Side Measurement
- Server-side logs (Pros)
- Reliable delivery tracking, consistent across platforms
- Server-side logs (Cons)
- Does not confirm actual ad playback or listener engagement
- Client-side data (Pros)
- Can reflect confirmed plays and audience behaviour
- Client-side data (Cons)
- Often limited, inconsistent or unavailable in open distribution
Brief, monitor and report
Ask for forecast impressions, estimated unique reach and frequency, together with their assumptions. If a cap is proposed, confirm which shows, creatives and platforms it covers. During the campaign, compare delivery with the forecast and check whether additional impressions are adding estimated recipients or mostly increasing repetition, where reporting allows.
Report reach beside a response measure suited to the objective, such as enquiries, orders using a code, visits to a dedicated page or a suitably designed brand study. State each measure's observation window. Delivery and response answer different questions; neither alone establishes which actions the campaign caused.
Pre-Campaign Checklist for Accurate Reach and Frequency Planning
- Confirm campaign dates and eligible Australian geography
- Verify inventory coverage and deduplication method
- Request forecast reach, frequency and assumptions
- Check if frequency caps are applied and where
- Align response measure with campaign objectivee.g., code usage, dedicated page visits, brand study
In this guide
- Estimating overlap across podcasts in a networkEstimate combined podcast reach with comparable audience figures, deduplication and clear limits on cross-show overlap data.
- Comparing repeated episode placements with a wider show mixCompare repeat podcast placements with adding shows using incremental reach, audience overlap and consistent campaign assumptions.
- Managing frequency in dynamically inserted campaignsDefine the scope and timing of a podcast frequency cap, check identification limits, and monitor delivery in a dynamically inserted campaign.
- Reading campaign reach alongside responseCompare estimated podcast reach with recorded actions using aligned periods, clear definitions and honest attribution limits.